
Sunday, September 22, 2013
Linear Trend
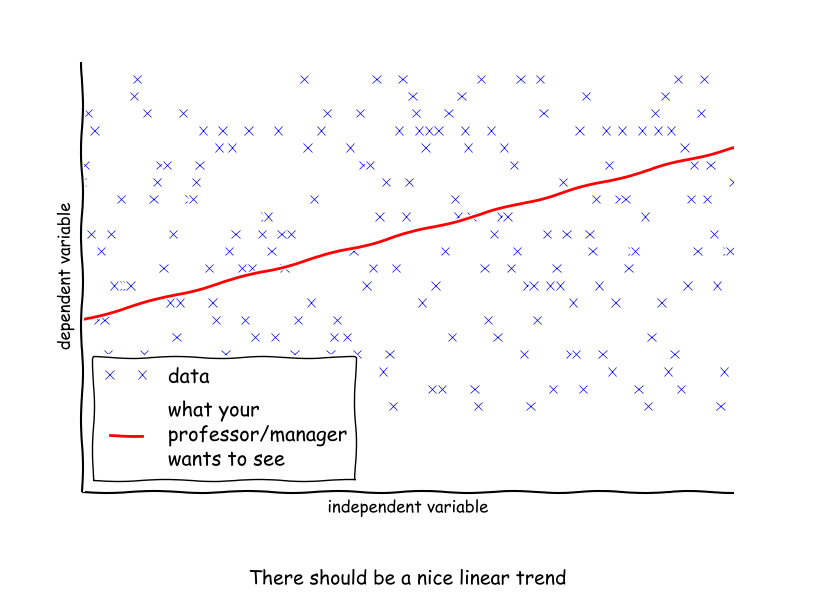
Often in my career I have been asked to mine data and find underlying trends. The hope of the requester, usually a manager or Professor when in grad school, was to see a nice linear trend. They would recommend I plot X versus Y and hopefully I would see the familiar linear relationship of y = mx + b. When that failed to produce the trend they wanted, they would start having me non-dimensional the variables (even if the variables were not non-dimensionalized appropriately). For example they would say "Divide X by Z and plot on a log scale." Usually the dimensions for X divided by Z would make no sense. I have created a nice little plot that summarizes these experiences (click on the image to enlarge).
I created the plot in Python using Matplotlib (see here for an example).
Subscribe to:
Comments (Atom)